Our capacity estimates are generated from a power flow model that projects future grid conditions. Because they rely on assumptions about events that haven't yet occurred, these figures should be treated as an early directional signal rather than a substitute for a formal, later-stage interconnection study, which will provide a more complete and current picture of available capacity.
- Find parcels with available capacity on the Map
- View substations with available capacity on the Map
- Review interconnection data in a Report
- Filter and export interconnection data from a Report
Finding Parcels Using Interconnection Filters
The Parcel Filter makes it easy to narrow the Map down to parcels with the infrastructure attributes you care about. To get started:
- Open the Map from the top navigation of any page.
- In the "Parcel Filters" menu, choose Proximity.

- In the pop-out, set the parameters for your search, including:

- Distance to Transmission Lines
- Transmission Line Voltage
- Line Owner [Contains]
- Distance to Substations
- Minimum Bus Voltage
- Minimum Injection Capacity
- Minimum Withdrawal Capacity (ERCOT only)
- Optionally, turn on the Transmission Lines or Substations layers to view them directly on the Map.
- Select Apply Filters when you're ready.
Any parcels that don't meet your criteria are automatically hidden, so only the parcels relevant to your search remain visible.
Viewing Substations with Available Capacity
If your organization has access to the Interconnection feature, you'll also have access to the Injection Capacity and Withdrawal Capacity (ERCOT only) map layers. To use them:
- Add the layers to the Map.
- Check the box next to the layer you want to activate. Note: only one of these two layers can be active at a time.

- Right-click any feature on the Map to see more details.
The colors on the Map represent available capacity levels, averaged across multiple years and scenarios:
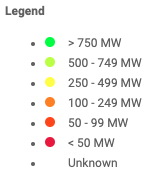
For example, if one scenario projects 10 MW of capacity and another projects 100 MW, the map color reflects the average of the two (e.g., red for anything under 50 MW). Because averaging can mask meaningful variation, we recommend always confirming exact figures in the Interconnection table before relying on them.
Reviewing Interconnection Data in a Report
“Nearest Substation” Card
Every generated Report includes a "Nearest Substation" card in the Executive Summary, showing the distance to the nearest substation, its maximum injection and withdrawal capacity (ERCOT only), and the nearest transmission line. Select View Details to dig deeper.
Interconnection Page
For a full breakdown, select View Details from the "Nearest Substation" card, or choose Interconnection from the left-side menu. This page gives you a complete view of the local grid — including owner, name, distance, voltage, and winter/summer capacity (MW) — for every substation and transmission line within 10 miles of your project.
You can also view:
- Capacity Information — Select your preferred capacity tab or select a substation to view it directly in the Report Map.


- Transmission Line Data — View the name, distance from the Area of Interest (AOI), and voltage of nearby lines.

- Interconnection Queue Data —At the bottom of the Interconnection page, you'll find queue data (sourced from the ISOs) for projects located in the same county as your AOI. This includes owner, capacity, status, projected commercial operation date (COD), and other relevant details.

Status codes vary by ISO. In ERCOT, for example:
- SS — Screening Study (started or completed)
- FIS — Full Interconnection Study (started or completed)
- IA — Interconnection Agreement (IA = executed; No IA = not yet executed)
Our power flow model only factors in projects with an executed Interconnection Agreement, since these are the ones most likely to be built — and therefore most likely to affect future capacity.
Filtering Interconnection Data
You can refine the data shown in two ways:
- By Year (Capacity Only):

- Select Add/Edit Years at the top right of the capacity table.
- Check the years you want to include/exclude — the table updates automatically.
- By Column:

-
 Sort: Click the arrow in a column header to sort ascending or descending.
 Filter: Click the filter icon in any column and enter your criteria — the table filters automatically. Select Clear Filters to reset.
Exporting Interconnection Data
To export transmission or interconnection queue data, click Export Table in the upper-right corner of the relevant data table.
Looking for distribution line data instead? Check out this article.