With Transect's Map Layers widget, you can visualize environmental data, political boundaries, infrastructure networks, and other pre-loaded datasets within your map.
In this article, you'll learn how to:
- View and Favorite a Map Layer
- Filter within a Map Layer
- View a Map Layer's Properties
- Locate a Map Layer's Reference Data
Viewing and Favoriting Map Layers
After navigating to the Map, users can easily add, remove, and favorite map layers from the widget.
- Within the Map Layers widget, use the 'Quick Filter' bar to search or scroll to locate your preferred layer.
- Activate a layer by selecting the checkbox, or remove a layer by deselecting the checkbox.
- When hovering over a layer, click the heart icon to add it to your favorites. Favorited layers are shown at the top in the "Favorites" section.
Filtering within a Map Layer
Some layers, such as the Electric Power Transmission Lines, offer additional filtering options in the map. To apply these filters:

-
- Select the dropdown next to a layer to view the legend and then click Filter.
- Next, choose an attribute and operation from the relevant dropdowns, then input a value.
- When finished, select the + to apply your changes.
Viewing a Map Layer's Properties
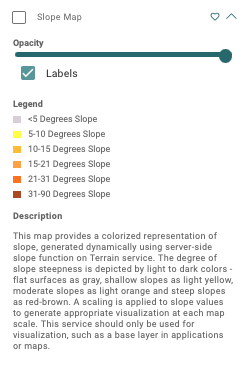
To learn more about a layer, select the dropdown arrow to the right of the layer name:
![]()
From here, you can adjust the opacity of the layer, add labels to the map, and view both the legend and the layer description.
Locating a Map Layer's Attribute Data
To view detailed attribute data within a map layer, such as the Parcel ID number, voltage for a transmission line, or wetland type, simply right-click on the desired data layer on the map. This action will generate a popup window that provides relevant data within the layer.

If multiple layers overlap, information boxes for each layer will appear when you click to view attribute data. You can use the left and right arrows at the top of the information popup to navigate between the attributes of each data layer.